Plotly FigureWidget 类
Plotly 3.0.0 引入了一个新的 Jupyter 小部件类: plotly.graph_objs.FigureWidget .它与我们现有的 Figure 具有相同的调用签名,并且它是专门为 Jupyter 笔记本 and JupyterLab 环境 .
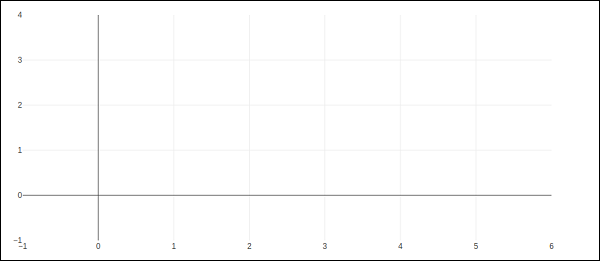
The go.FigureWiget() 函数 返回一个空的 FigureWidget 对象,默认 x 和 y axes.
f = go.FigureWidget()
iplot(f)
下面给出代码的输出:
FigureWidget 最重要的特性是生成的 Plotly 图形,它可以在我们继续向其添加数据和其他布局属性时动态更新。
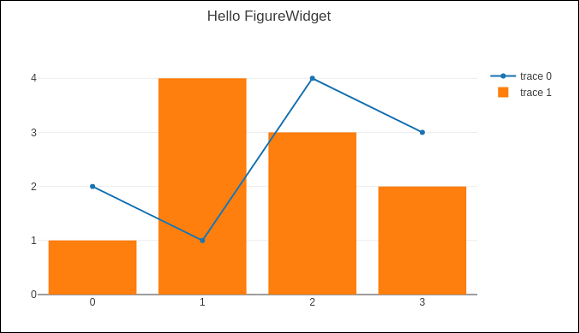
例如,将以下图形轨迹一一添加,看到原始空图动态更新。这意味着我们不必一次又一次地调用 iplot() 函数,因为绘图会自动刷新。 FigureWidget 的最终外观如下图所示:
f.add_scatter(y = [2, 1, 4, 3]);
f.add_bar(y = [1, 4, 3, 2]);
f.layout.title = 'Hello FigureWidget'
此小部件能够为悬停、单击和选择点以及放大区域的事件侦听器。
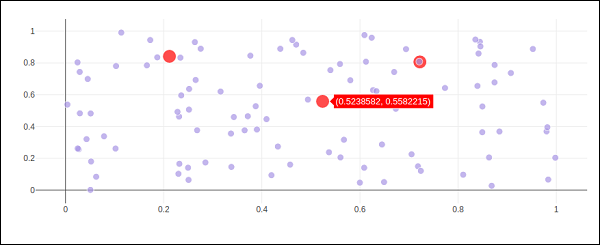
在以下示例中,FigureWidget 被编程为响应绘图区域上的单击事件。小部件本身包含一个带有标记的简单散点图。鼠标点击位置标有不同的颜色和大小。
x = np.random.rand(100)
y = np.random.rand(100)
f = go.FigureWidget([go.Scatter(x=x, y=y, mode='markers')])

scatter = f.data[0]
colors = ['#a3a7e4'] * 100

scatter.marker.color = colors
scatter.marker.size = [10] * 100
f.layout.hovermode = 'closest'
def update_point(trace, points, selector):

c = list(scatter.marker.color)
s = list(scatter.marker.size)
for i in points.point_inds:

c[i] = 'red'
s[i] = 20

scatter.marker.color = c
scatter.marker.size = s
scatter.on_click(update_point)
f
在 Jupyter notebook 中运行上面的代码。显示散点图。单击该区域中将用红色标记的位置。
Plotly 的 FigureWidget 对象也可以利用 伊蟒的 自己的小部件。在这里,我们使用定义的交互控制 ipwidgets 模块。我们首先构建一个 图小部件 并添加一个 空散点图 .
from ipywidgets import interact
fig = go.FigureWidget()
scatt = fig.add_scatter()
fig
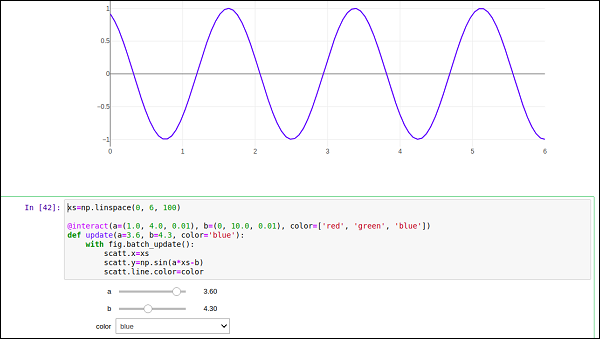
我们现在定义一个 更新功能 输入频率和相位并设置 x 和 y 的属性 散点迹 定义如上。这 @interact 装饰器 来自 ipywidgets 模块用于创建一组简单的小部件来控制绘图的参数。更新功能装饰有 @interact 装饰器 from the ipywidgets 包 .装饰器参数用于指定我们想要扫描的参数范围。
xs = np.linspace(0, 6, 100)
@interact(a = (1.0, 4.0, 0.01), b = (0, 10.0, 0.01), color = ['red', 'green', 'blue'])
def update(a = 3.6, b = 4.3, color = 'blue'):
with fig.batch_update():
scatt.x = xs
scatt.y = np.sin(a*xs-b)
scatt.line.color = color
空的 FigureWidget 现在填充为蓝色 正弦曲线 a and b 分别为 3.6 和 4.3。在当前笔记本单元格下方,你将获得一组用于选择值的滑块 a and b .还有一个下拉菜单可以选择跟踪颜色。这些参数定义在 @interact 装饰器 .