聚类算法 Mean Shift 算法
如前所述,它是无监督学习中使用的另一种强大的聚类算法。与 K-means 聚类不同,它不做任何假设;因此它是一种非参数算法。
均值移位算法基本上通过将点移向数据点的最高密度(即集群质心)迭代地将数据点分配给集群。
K-Means 算法和 Mean-Shift 的区别在于后面不需要提前指定簇的数量,因为簇的数量将由算法 w.r.t 数据决定。
Mean-Shift算法的工作原理
我们可以通过以下步骤来理解 Mean-Shift 聚类算法的工作原理:
-
步骤 1 : 首先,从分配给自己的集群的数据点开始。
-
步骤 2 : 接下来,该算法将计算质心。
-
步骤 3 : 在这一步中,将更新新质心的位置。
-
步骤 4 : 现在,该过程将被迭代并移动到更高密度的区域。
-
步骤 5 : 最后,一旦质心到达不能进一步移动的位置,它就会停止。
用 Python 实现
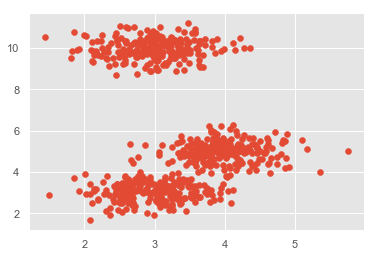
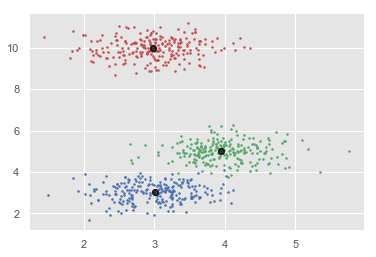
这是一个了解 Mean-Shift 算法如何工作的简单示例。在此示例中,我们将首先生成包含 4 个不同 blob 的 2D 数据集,然后应用 Mean-Shift 算法查看结果。
%matplotlib inline
import numpy as np
from sklearn.cluster import MeanShift
import matplotlib.pyplot as plt
from matplotlib import style
style.use("ggplot")
from sklearn.datasets.samples_generator import make_blobs
centers = [[3,3,3],[4,5,5],[3,10,10]]
X, _ = make_blobs(n_samples = 700, centers = centers, cluster_std = 0.5)
plt.scatter(X[:,0],X[:,1])
plt.show()
ms = MeanShift()
ms.fit(X)
labels = ms.labels_
cluster_centers = ms.cluster_centers_
print(cluster_centers)
n_clusters_ = len(np.unique(labels))
print("Estimated clusters:", n_clusters_)
colors = 10*['r.','g.','b.','c.','k.','y.','m.']
for i in range(len(X)):
    plt.plot(X[i][0], X[i][1], colors[labels[i]], markersize = 3)
plt.scatter(cluster_centers[:,0],cluster_centers[:,1],
    marker=".",color='k', s=20, linewidths = 5, zorder=10)
plt.show()
输出
[[ 2.98462798 9.9733794 10.02629344]
[ 3.94758484 4.99122771 4.99349433]
[ 3.00788996 3.03851268 2.99183033]]
Estimated clusters: 3
的优点和缺点
优点
以下是Mean-Shift聚类算法的一些优点:
-
它不需要像 K-means 或高斯混合那样做任何模型假设。
-
它还可以对具有非凸形状的复杂簇进行建模。
-
它只需要一个名为带宽的参数,它会自动确定集群的数量。
-
没有像 K-means 那样的局部最小值问题。
-
异常值不会产生问题。
缺点
以下是Mean-Shift聚类算法的一些缺点:
Mean-shift算法在高维情况下效果不佳,其中簇数突然变化。
-
我们无法直接控制集群的数量,但在某些应用程序中,我们需要特定数量的集群。
-
它无法区分有意义和无意义的模式。