Bokeh 字形图
任何情节通常由一个或多个几何形状组成,例如 线,圆,矩形, 等等。这些形状具有关于相应数据集的视觉信息。在 Bokeh 术语中,这些几何形状被称为 gylphs。使用构建的Bokeh 图 Bokeh 绘图界面 使用一组默认的工具和样式。但是,可以使用可用的绘图工具自定义样式。
地块类型
使用字形创建的不同类型的图如下:
线图
这种类型的绘图对于以线的形式可视化点沿 x 轴和 y 轴的移动很有用。它用于执行时间序列分析。
Bar plot
这对于指示数据集中特定列或字段的每个类别的计数通常很有用。
补丁图
该图表示具有特定颜色阴影的点区域。这种类型的图用于区分同一数据集中的不同组。
散点图
这种类型的图用于可视化两个变量之间的关系并指示它们之间的相关强度。
通过调用 Figure 类的适当方法形成不同的字形图。 Figure 对象通过如下构造函数获取:
from bokeh.plotting import figure
figure(**kwargs)
Figure 对象可以通过各种关键字参数进行自定义。
| 序号 | Title | 设置情节的标题 |
|---|---|---|
| 1 | x_axis_label | 设置 x 轴的标题 |
| 2 | y_axis_label | 为 y 轴设置标题 |
| 3 | 绘图宽度 | 设置图形宽度 |
| 4 | 情节高度 | 设置图形高度 |
线图
The 线()方法 Figure 对象添加线条字形到 Bokeh 图形。它需要 x 和 y 参数作为数据数组来显示它们的线性关系。
from bokeh.plotting import figure, show
fig = figure()
fig.line(x,y)
show(fig)
以下代码以 Python 列表对象的形式呈现两组值之间的简单线图:
from bokeh.plotting import figure, output_file, show
x = [1,2,3,4,5]
y = [2,4,6,8,10]
output_file('line.html')
fig = figure(title = 'Line Plot example', x_axis_label = 'x', y_axis_label = 'y')
fig.line(x,y)
show(fig)
输出

Bar plot
图形对象有两种不同的构建条形图的方法
hbar()
条形图在绘图宽度上水平显示。这 hbar() 方法 有以下参数:
| 序号 | y | 水平条中心的 y 坐标。 |
|---|---|---|
| 1 | height | 垂直条的高度。 |
| 2 | right | 右边缘的 x 坐标。 |
| 3 | left | 左边缘的 x 坐标。 |
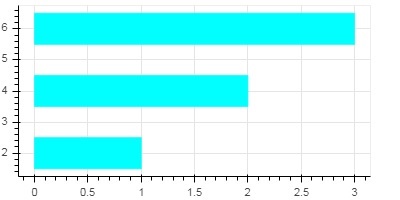
下面的代码是一个例子 单杠 使用Bokeh 。
from bokeh.plotting import figure, output_file, show
fig = figure(plot_width = 400, plot_height = 200)
fig.hbar(y = [2,4,6], height = 1, left = 0, right = [1,2,3], color = "Cyan")
output_file('bar.html')
show(fig)
输出
vbar()
条形图垂直显示在绘图高度上。这 vbar() 方法 有以下参数:
| 序号 | x | 垂直条中心的 x 坐标。 |
|---|---|---|
| 1 | width | 垂直条的宽度。 |
| 2 | top | 顶部边缘的 y 坐标。 |
| 3 | bottom | 底部边缘的 y 坐标。 |
以下代码显示 垂直条形图 :
from bokeh.plotting import figure, output_file, show
fig = figure(plot_width = 200, plot_height = 400)
fig.vbar(x = [1,2,3], width = 0.5, bottom = 0, top = [2,4,6], color = "Cyan")
output_file('bar.html')
show(fig)
输出

补丁图
以特定颜色对空间区域进行着色以显示具有相似属性的区域或组的图在 Bokeh 中称为斑块图。图形对象为此目的具有 patch() 和 patch() 方法。
patch()
此方法将补丁字形添加到给定图形。该方法有以下参数:
| 1 | x | 补丁点的 x 坐标。 |
| 2 | y | 补丁点的 y 坐标。 |
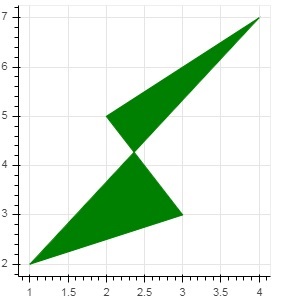
A simple 补丁图 通过以下Python代码获取:
from bokeh.plotting import figure, output_file, show
p = figure(plot_width = 300, plot_height = 300)
p.patch(x = [1, 3,2,4], y = [2,3,5,7], color = "green")
output_file('patch.html')
show(p)
补丁()
此方法用于绘制多个多边形补丁。它需要以下参数:
| 1 | xs | 所有补丁的 x 坐标,以“列表列表”的形式给出。 |
| 2 | ys | 所有补丁的 y 坐标,以“列表列表”的形式给出。 |
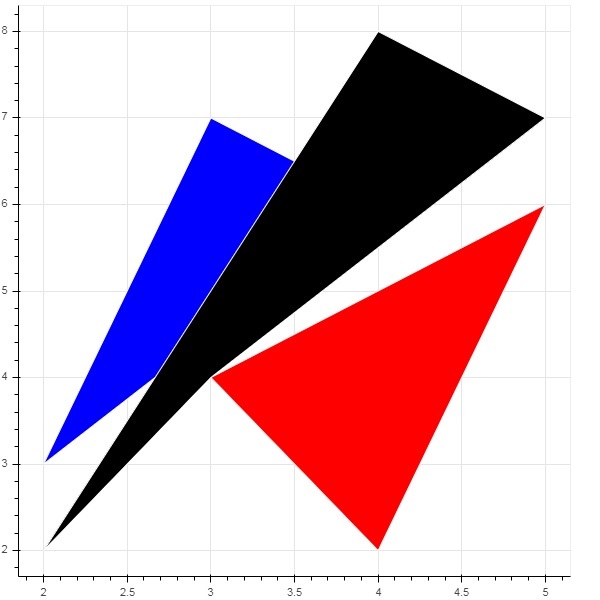
作为 patch() 方法的示例,运行以下代码:
from bokeh.plotting import figure, output_file, show
xs = [[5,3,4], [2,4,3], [2,3,5,4]]
ys = [[6,4,2], [3,6,7], [2,4,7,8]]
fig = figure()
fig.patches(xs, ys, fill_color = ['red', 'blue', 'black'], line_color = 'white')
output_file('patch_plot.html')
show(fig)
分散标记
散点图非常常用来确定两个变量之间的双变量关系。使用 Bokeh 为它们添加了增强的交互性。散点图是通过调用 Figure 对象的 scatter() 方法获得的。它使用以下参数:
| 1 | x | 中心 x 坐标的值或字段名称 |
| 2 | y | 中心 y 坐标的值或字段名称 |
| 3 | size | 以屏幕为单位的尺寸值或字段名称 |
| 4 | marker | 标记类型的值或字段名称 |
| 5 | color | 设置填充和线条颜色 |
Bokeh 中定义了以下标记类型常量:
- Asterisk
- Circle
- 圆十字
- CircleX
- Cross
- Dash
- Diamond
- 钻石十字架
- Hex
- 倒三角
- Square
- 方十字
- SquareX
- Triangle
- X
以下 Python 代码生成带有圆圈标记的散点图。
from bokeh.plotting import figure, output_file, show
fig = figure()
fig.scatter([1, 4, 3, 2, 5], [6, 5, 2, 4, 7], marker = "circle", size = 20, fill_color = "grey")
output_file('scatter.html')
show(fig)
