Bokeh 轴
在本章中,我们将讨论各种类型的轴。
| 序号 | Axes | 描述 |
|---|---|---|
| 1 | 分类轴 | Bokeh 图沿 x 和 y 轴显示数值数据。为了沿任一轴使用分类数据,我们需要指定一个 FactorRange 来为其中一个指定分类维度。 |
| 2 | 对数刻度轴 | 如果 x 和 y 数据系列之间存在幂律关系,则最好在两个轴上使用对数刻度。 |
| 3 | 双轴 | 可能需要在单个绘图图形上显示代表不同范围的多个轴。图形对象可以通过定义来配置 extra_x_range and extra_y_range 特性 |
分类轴
在到目前为止的示例中,Bokeh 图沿 x 和 y 轴显示数值数据。为了沿任一轴使用分类数据,我们需要指定一个 FactorRange 来为其中一个指定分类维度。例如,要使用给定列表中的字符串作为 x 轴:
langs = ['C', 'C++', 'Java', 'Python', 'PHP']
fig = figure(x_range = langs, plot_width = 300, plot_height = 300)
例子
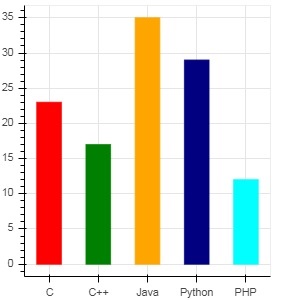
在下面的示例中,显示了一个简单的条形图,显示了参加各种课程的学生人数。
from bokeh.plotting import figure, output_file, show
langs = ['C', 'C++', 'Java', 'Python', 'PHP']
students = [23,17,35,29,12]
fig = figure(x_range = langs, plot_width = 300, plot_height = 300)
fig.vbar(x = langs, top = students, width = 0.5)
show(fig)

要以不同颜色显示每个条,请将 vbar() 函数的颜色属性设置为颜色值列表。
cols = ['red','green','orange','navy', 'cyan']
fig.vbar(x = langs, top = students, color = cols,width=0.5)
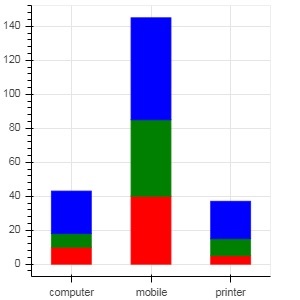
要使用 vbar_stack() 或 hbar_stack() 函数渲染垂直(或水平)堆叠条,请将 stackers 属性设置为要连续堆叠的字段列表,并将 source 属性设置为包含与每个字段对应的值的 dict 对象。
在以下示例中,sales 是一个字典,显示三个月内三种产品的销售数据。
from bokeh.plotting import figure, output_file, show
products = ['computer','mobile','printer']
months = ['Jan','Feb','Mar']
sales = {'products':products,
    'Jan':[10,40,5],
    'Feb':[8,45,10],
    'Mar':[25,60,22]}
cols = ['red','green','blue']#,'navy', 'cyan']
fig = figure(x_range = products, plot_width = 300, plot_height = 300)
fig.vbar_stack(months, x = 'products', source = sales, color = cols,width = 0.5)
show(fig)
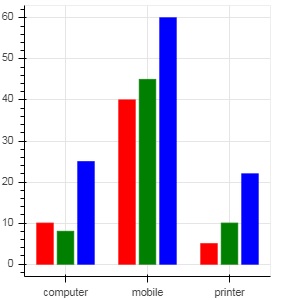
通过在 dodge() 函数的帮助下指定条形的视觉位移来获得分组条形图 Bokeh 变换 module.
The 闪避()函数 introduces a relative offset for each bar plot thereby achieving a visual impression of group. In following example, vbar() 字形 对于特定月份的每组条形,由 0.25 的偏移量分隔。
from bokeh.plotting import figure, output_file, show
from bokeh.transform import dodge
products = ['computer','mobile','printer']
months = ['Jan','Feb','Mar']
sales = {'products':products,
    'Jan':[10,40,5],
    'Feb':[8,45,10],
    'Mar':[25,60,22]}
fig = figure(x_range = products, plot_width = 300, plot_height = 300)
fig.vbar(x = dodge('products', -0.25, range = fig.x_range), top = 'Jan',
    width = 0.2,source = sales, color = "red")
fig.vbar(x = dodge('products', 0.0, range = fig.x_range), top = 'Feb',
    width = 0.2, source = sales,color = "green")
fig.vbar(x = dodge('products', 0.25, range = fig.x_range), top = 'Mar',
    width = 0.2,source = sales,color = "blue")
show(fig)
对数刻度轴
当图的一个轴上的值随着另一个轴的线性增加值呈指数增长时,通常需要将前一个轴上的数据显示在对数刻度上。例如,如果 x 和 y 数据系列之间存在幂律关系,则最好在两个轴上使用对数刻度。
Bokeh.plotting API 的 figure() 函数接受 x_axis_type 和 y_axis_type 作为参数,可以通过为这些参数中的任何一个传递“log”来指定为对数轴。
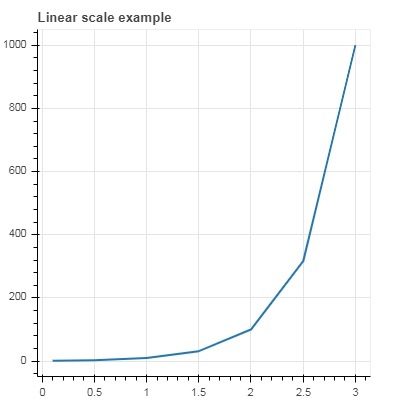
第一个图显示了 x 和 10x 之间的线性比例图。在第二个图中 y_axis_type 设置为 'log'
from bokeh.plotting import figure, output_file, show
x = [0.1, 0.5, 1.0, 1.5, 2.0, 2.5, 3.0]
y = [10**i for i in x]
fig = figure(title = 'Linear scale example',plot_width = 400, plot_height = 400)
fig.line(x, y, line_width = 2)
show(fig)
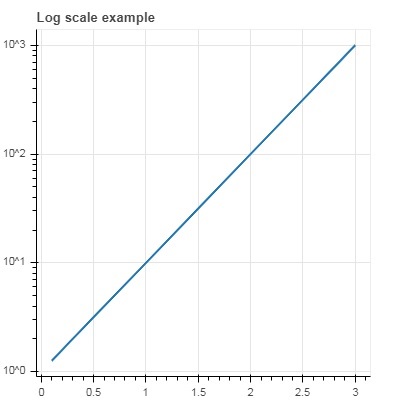
现在更改 figure() 函数以配置 y_axis_type='log'
fig = figure(title = 'Linear scale example',plot_width = 400, plot_height = 400, y_axis_type = "log")
双轴
在某些情况下,可能需要在单个绘图图形上显示表示不同范围的多个轴。图形对象可以通过定义来配置 extra_x_range and extra_y_range 特性。在向图形添加新字形时,会使用这些命名范围。
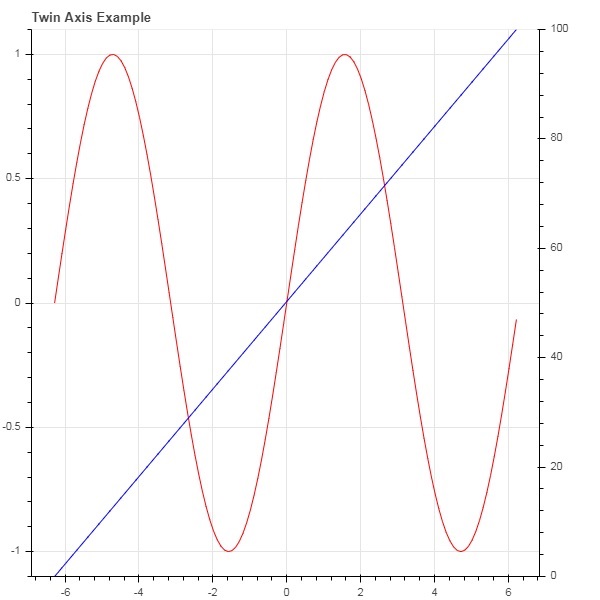
我们尝试在同一个图中显示正弦曲线和直线。两个字形都有不同范围的 y 轴。正弦曲线和直线的 x 和 y 数据系列通过以下方式获得:
from numpy import pi, arange, sin, linspace
x = arange(-2*pi, 2*pi, 0.1)
y = sin(x)
y2 = linspace(0, 100, len(y))
这里,x 和 y 之间的曲线表示正弦关系,x 和 y2 之间的曲线是一条直线。 Figure 对象定义了明确的 y_range 并添加了一个表示正弦曲线的线条符号如下:
fig = figure(title = 'Twin Axis 例子', y_range = (-1.1, 1.1))
fig.line(x, y, color = "red")
我们需要一个额外的 y 范围。定义为:
fig.extra_y_ranges = {"y2": Range1d(start = 0, end = 100)}
要在右侧添加额外的 y 轴,请使用 add_layout() 方法。在图中添加一个表示 x 和 y2 的新行字形。
fig.add_layout(LinearAxis(y_range_name = "y2"), 'right')
fig.line(x, y2, color = "blue", y_range_name = "y2")
这将产生一个带有双 y 轴的图。完整代码,输出如下:
from numpy import pi, arange, sin, linspace
x = arange(-2*pi, 2*pi, 0.1)
y = sin(x)
y2 = linspace(0, 100, len(y))
from bokeh.plotting import output_file, figure, show
from bokeh.models import LinearAxis, Range1d
fig = figure(title='Twin Axis 例子', y_range = (-1.1, 1.1))
fig.line(x, y, color = "red")
fig.extra_y_ranges = {"y2": Range1d(start = 0, end = 100)}
fig.add_layout(LinearAxis(y_range_name = "y2"), 'right')
fig.line(x, y2, color = "blue", y_range_name = "y2")
show(fig)