Bokeh 过滤数据
通常,你可能希望获得与满足特定条件的部分数据相关的图,而不是整个数据集。 bokeh.models 模块中定义的 CDSView 类的对象通过在其上应用一个或多个过滤器来返回正在考虑的 ColumnDatasource 的子集。
IndexFilter 是最简单的过滤器类型。你必须仅指定数据集中要在绘制图形时使用的那些行的索引。
以下示例演示了使用 IndexFilter 来设置 CDSView。结果图显示了 ColumnDataSource 的 x 和 y 数据系列之间的线条字形。通过在其上应用索引过滤器来获得视图对象。该视图用于绘制作为 IndexFilter 的结果的圆形字形。
例子
from bokeh.models import ColumnDataSource, CDSView, IndexFilter
from bokeh.plotting import figure, output_file, show
source = ColumnDataSource(data = dict(x = list(range(1,11)), y = list(range(2,22,2))))
view = CDSView(source=source, filters = [IndexFilter([0, 2, 4,6])])
fig = figure(title = 'Line Plot example', x_axis_label = 'x', y_axis_label = 'y')
fig.circle(x = "x", y = "y", size = 10, source = source, view = view, legend = 'filtered')
fig.line(source.data['x'],source.data['y'], legend = 'unfiltered')
show(fig)
输出

要仅从数据源中选择满足特定布尔条件的那些行,请应用 BooleanFilter。
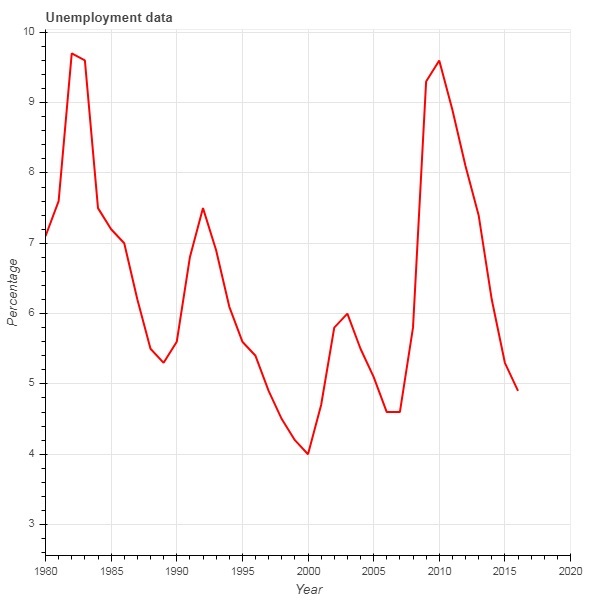
典型的 Bokeh 安装由 sampledata 目录中的许多示例数据集组成。对于以下示例,我们使用 失业1948 数据集以失业1948.csv 的形式提供。它存储了自 1948 年以来美国的年度失业率百分比。我们只想生成 1980 年以后的图。为此,通过在给定数据源上应用 BooleanFilter 来获得 CDSView 对象。
from bokeh.models import ColumnDataSource, CDSView, BooleanFilter
from bokeh.plotting import figure, show
from bokeh.sampledata.unemployment1948 import data
source = ColumnDataSource(data)
booleans = [True if int(year) >= 1980 else False for year in
source.data['Year']]
print (booleans)
view1 = CDSView(source = source, filters=[BooleanFilter(booleans)])
p = figure(title = "Unemployment data", x_range = (1980,2020), x_axis_label = 'Year', y_axis_label='Percentage')
p.line(x = 'Year', y = 'Annual', source = source, view = view1, color = 'red', line_width = 2)
show(p)
输出
为了增加应用过滤器的灵活性,Bokeh 提供了一个 CustomJSFilter 类,借助该类可以使用用户定义的 JavaScript 函数过滤数据源。
下面给出的示例使用相同的美国失业数据。定义一个 CustomJSFilter 来绘制 1980 年及之后的失业数据。
from bokeh.models import ColumnDataSource, CDSView, CustomJSFilter
from bokeh.plotting import figure, show
from bokeh.sampledata.unemployment1948 import data
source = ColumnDataSource(data)
custom_filter = CustomJSFilter(code = '''
    var indices = [];

    for (var i = 0; i < source.get_length(); i++){
        if (parseInt(source.data['Year'][i]) > = 1980){
            indices.push(true);
        } else {
            indices.push(false);
        }
    }
    return indices;
''')
view1 = CDSView(source = source, filters = [custom_filter])
p = figure(title = "Unemployment data", x_range = (1980,2020), x_axis_label = 'Year', y_axis_label = 'Percentage')
p.line(x = 'Year', y = 'Annual', source = source, view = view1, color = 'red', line_width = 2)
show(p)