Matplotlib 设置限制
Matplotlib 自动得出要沿绘图的 x、y(在 3D 绘图的情况下为 z 轴)轴显示的变量的最小值和最大值。但是,可以通过使用显式设置限制set_xlim()和set_ylim()函数。
在下图中,显示了 x 和 y 轴的自动缩放限制:
import matplotlib.pyplot as plt
fig = plt.figure()
a1 = fig.add_axes([0,0,1,1])
import numpy as np
x = np.arange(1,10)
a1.plot(x, np.exp(x))
a1.set_title('exp')
plt.show()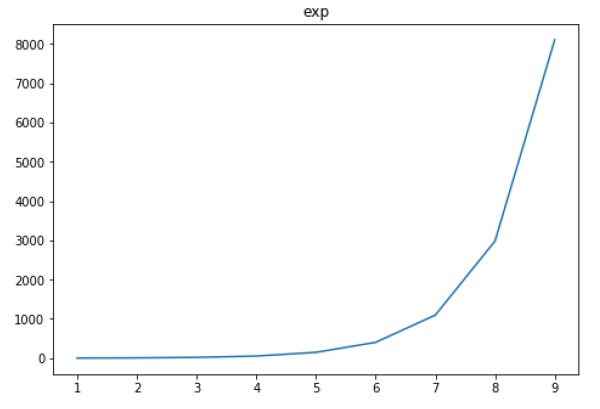
现在我们将 x 轴上的限制格式化为(0 到 10)和 y 轴(0 到 10000):
import matplotlib.pyplot as plt
fig = plt.figure()
a1 = fig.add_axes([0,0,1,1])
import numpy as np
x = np.arange(1,10)
a1.plot(x, np.exp(x),'r')
a1.set_title('exp')
a1.set_ylim(0,10000)
a1.set_xlim(0,10)
plt.show()