Matplotlib 多图
在本章中,我们将学习如何在同一画布上创建多个子图。
subplot()函数返回给定网格位置的轴对象,该函数的签名为:
plt.subplot(subplot(nrows, ncols, index)
在当前图中,该函数在 ncolsaxes 的 nrows 网格的位置索引处创建并返回一个 Axes 对象,索引从 1 到 nrows * ncols,按行优先顺序递增。如果 nrows、ncols 和索引都小于 10。索引也可以作为单个、连接、三位数给出。
例如, subplot(2, 3, 3) 和 subplot(233) 都在当前图形的右上角创建一个 Axes,占据图形高度的一半和图形宽度的三分之一。
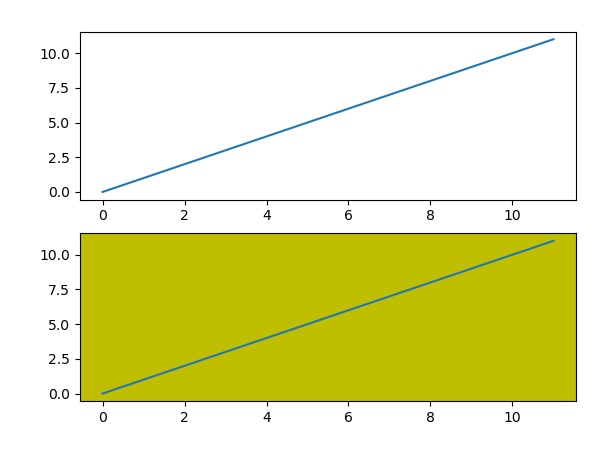
创建子图将删除任何与其共享边界之外与其重叠的预先存在的子图。
import matplotlib.pyplot as plt
# plot a line, implicitly creating a subplot(111)
plt.plot([1,2,3])
# now create a subplot which represents the top plot of a grid with 2 rows and 1 column.
#Since this subplot will overlap the first, the plot (and its axes) previously
created, will be removed
plt.subplot(211)
plt.plot(range(12))
plt.subplot(212, facecolor='y') # creates 2nd subplot with yellow background
plt.plot(range(12))
上面的代码行生成以下输出:
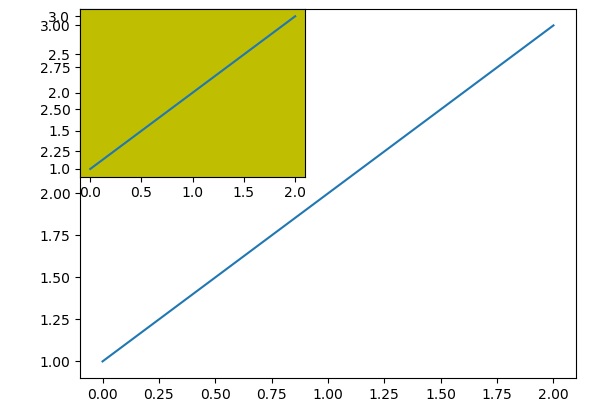
图类的 add_subplot() 函数不会覆盖现有的绘图:
import matplotlib.pyplot as plt
fig = plt.figure()
ax1 = fig.add_subplot(111)
ax1.plot([1,2,3])
ax2 = fig.add_subplot(221, facecolor='y')
ax2.plot([1,2,3])
执行上述代码行时,会生成以下输出:
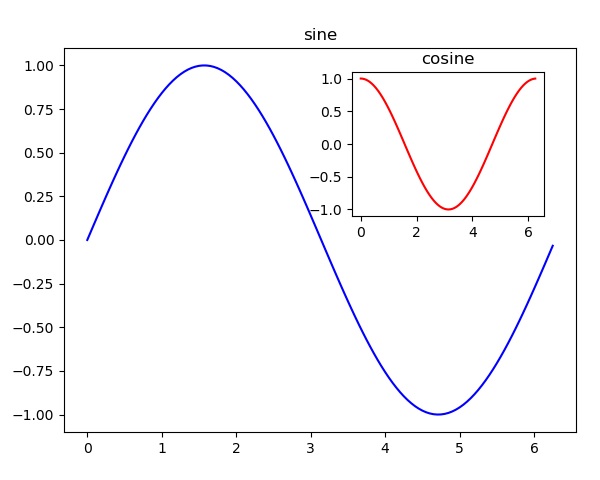
你可以通过在同一图形画布中添加另一个轴对象在同一图形中添加插入图。
import matplotlib.pyplot as plt
import numpy as np
import math
x = np.arange(0, math.pi*2, 0.05)
fig=plt.figure()
axes1 = fig.add_axes([0.1, 0.1, 0.8, 0.8]) # main axes
axes2 = fig.add_axes([0.55, 0.55, 0.3, 0.3]) # inset axes
y = np.sin(x)
axes1.plot(x, y, 'b')
axes2.plot(x,np.cos(x),'r')
axes1.set_title('sine')
axes2.set_title("cosine")
plt.show()
执行上述代码行后,会生成以下输出: