Kibana 使用坐标图
Kibana 中的坐标图将向你显示地理区域,并根据你指定的聚合用圆圈标记该区域。
为坐标图创建索引
用于坐标图的 Bucket 聚合是 geohash 聚合。对于这种类型的聚合,你要使用的索引应该有一个地理点类型的字段。地理点是纬度和经度的组合。
我们将使用 Kibana 开发工具创建索引并向其中添加批量数据。我们将添加映射并添加我们需要的 geo_point 类型。
我们将要使用的数据如下所示:
{"index":{"_id":1}}
{"location": "2.089330000000046,41.47367000000008", "city": "SantCugat"}
{"index":{"_id":2}}
{"location": "2.2947825000000677,41.601800991000076", "city": "Granollers"}
{"index":{"_id":3}}
{"location": "2.1105957495300474,41.5496295760424", "city": "Sabadell"}
{"index":{"_id":4}}
{"location": "2.132605678083895,41.5370461908878", "city": "Barbera"}
{"index":{"_id":5}}
{"location": "2.151270020052683,41.497779918345415", "city": "Cerdanyola"}
{"index":{"_id":6}}
{"location": "2.1364609496220606,41.371303520399344", "city": "Barcelona"}
{"index":{"_id":7}}
{"location": "2.0819450306711165,41.385491966414705", "city": "Sant Just Desvern"}
{"index":{"_id":8}}
{"location": "2.00532082278266,41.542294286427385", "city": "Rubi"}
{"index":{"_id":9}}
{"location": "1.9560805366930398,41.56142635214226", "city": "Viladecavalls"}
{"index":{"_id":10}}
{"location": "2.09205348251486,41.39327140161001", "city": "Esplugas de Llobregat"}
现在,在 Kibana Dev Tools 中运行以下命令,如下图所示:
PUT /cities
{
"mappings": {
"_doc": {
"properties": {
"location": {
"type": "geo_point"
}
}
}
}
}
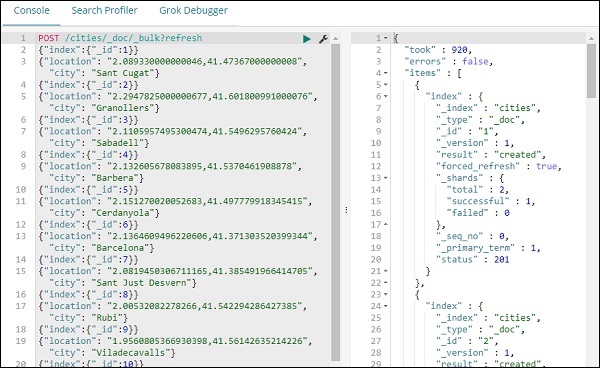
POST /cities/_city/_bulk?refresh
{"index":{"_id":1}}
{"location": "2.089330000000046,41.47367000000008", "city": "SantCugat"}
{"index":{"_id":2}}
{"location": "2.2947825000000677,41.601800991000076", "city": "Granollers"}
{"index":{"_id":3}}
{"location": "2.1105957495300474,41.5496295760424", "city": "Sabadell"}
{"index":{"_id":4}}
{"location": "2.132605678083895,41.5370461908878", "city": "Barbera"}
{"index":{"_id":5}}
{"location": "2.151270020052683,41.497779918345415", "city": "Cerdanyola"}
{"index":{"_id":6}}
{"location": "2.1364609496220606,41.371303520399344", "city": "Barcelona"}
{"index":{"_id":7}}
{"location": "2.0819450306711165,41.385491966414705", "city": "Sant Just Desvern"}
{"index":{"_id":8}}
{"location": "2.00532082278266,41.542294286427385", "city": "Rubi"}
{"index":{"_id":9}}
{"location": "1.9560805366930398,41.56142635214226", "city": "Viladecavalls"}
{"index":{"_id":10}}
{"location": "2.09205348251486,41.3s9327140161001", "city": "Esplugas de Llobregat"}
现在,在 Kibana 开发工具中运行上述命令:
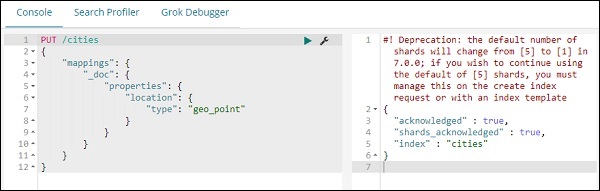
上面将创建 _doc 类型的索引名称城市,并且字段位置是 geo_point 类型。
现在让我们在索引中添加数据: 城市:
我们已完成使用数据创建索引名称引用。现在让我们使用管理选项卡为城市创建索引模式。

城市索引内的字段详情如下:
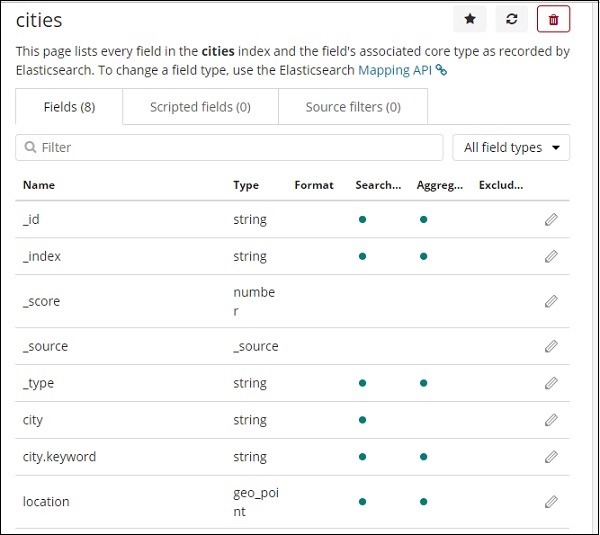
我们可以看到 location 的类型是 geo_point。我们现在可以使用它来创建可视化。
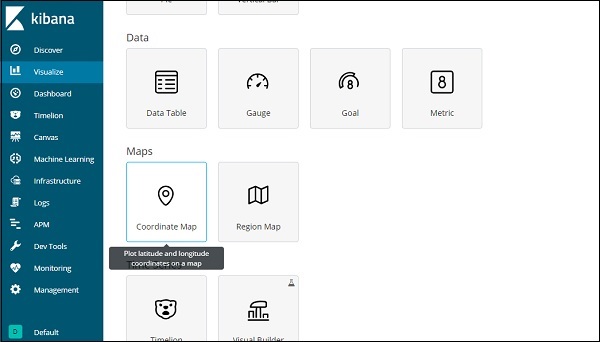
坐标图入门
转到可视化并选择坐标图。
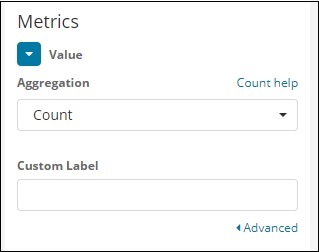
选择索引模式城市,配置Aggregation metric和bucket,如下图:
点击分析按钮,可以看到如下画面:
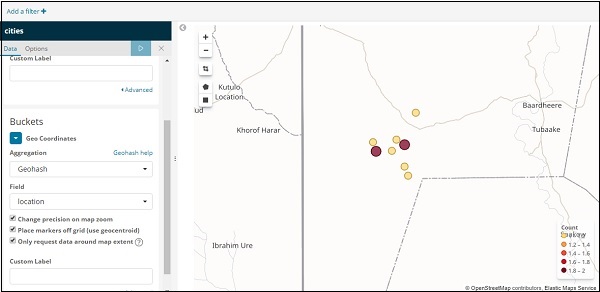
根据经度和纬度,圆圈绘制在地图上,如上图所示。